
In Estonia and across Europe, the construction sector is rapidly moving towards a low-carbon and environmentally conscious future. While just a few years ago the conversation was predominantly about the carbon footprint, since 2025 the focus has broadened: the environmental impact of buildings must now be assessed in a holistic manner. What does this mean in practice? Why is it no longer sufficient to calculate only CO₂ emissions? What does a building’s full environmental footprint actually encompass? And why does Estonia operate under the assumption that a building’s carbon footprint is the same as its environmental footprint?
The national development direction for the construction and real estate sector supports the achievement of climate neutrality objectives. Accordingly, the point of departure has been the new Energy Performance of Buildings Directive (EU) 2024/1275 (EPBD) and its obligation to report lifecycle carbon footprint data for buildings. Under the directive, from 1 January 2028 all buildings owned by public sector bodies must be zero-emission buildings, and from 1 January 2030 all new buildings must be zero-emission. The carbon footprint must be measured using the Global Warming Potential indicator (GWP), calculated in accordance with Annex III of the directive, and disclosed on the building’s energy performance certificate: from 1 January 2027 for all new buildings with a floor area exceeding 1,000 m2, and from 1 January 2030 for all new buildings.
Based on the directive, a national carbon footprint calculation methodology for Estonian construction has been developed at the request of the Ministry of Economic Affairs and Communications. After testing and further development, it is intended that this methodology will in time become Estonia’s national method for calculating a building’s environmental performance[i]. An important component of this is the Estonian building materials climate impact database (EHEA), which can be used to calculate the lifecycle climate impacts of buildings, structures, and infrastructure[ii]. The database describes the typical situation on the market and is designed for architects and designers with the aim of selecting the best design solutions from a climate impact perspective. An open-source tool (SARV) has also been developed to simplify calculations for businesses. Most importantly, the database will serve as the basis for setting and monitoring climate impact reduction targets for Estonia’s construction sector.
A building’s climate impact is not the same as a building’s environmental impact — it is only one part of it
While the Energy Performance of Buildings Directive expresses a building’s climate impact in kilograms of CO₂ equivalent per square metre of usable floor area, expressing environmental impact requires accounting also for the resource use impact of the materials used in construction. Environmental impact must be defined in accordance with the definition provided in standard EVS-EN ISO 14025, which describes it as any adverse or beneficial change in the environment arising fully or partially from an organisation’s environmental aspects. Accordingly, national objectives for reducing the climate impact of the construction sector cannot be equated with market participants’ environmental impact reduction objectives. The applicable indicators also differ: the measurement of the construction sector’s climate impact uses only indicator 1.2 of the EU Commission’s Level(s) sustainable buildings framework — the lifecycle global warming potential (GWP). This, however, is just one of the sixteen indicators in the Level(s) methodology. The Level(s) framework is built on 6 macro-level objectives addressing key aspects of sustainability from a building lifecycle perspective. The framework provides all the indicators needed to assess and monitor progress against these macro-level objectives, an overview of which is presented in the figure below.
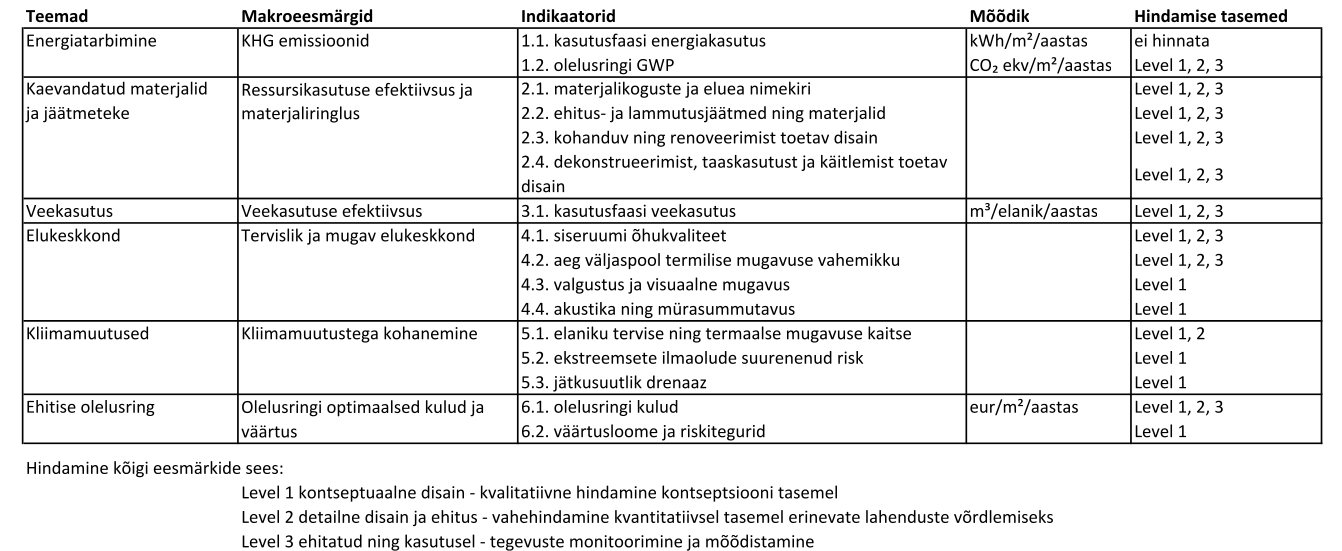
Thus, a building’s climate impact is only one component of its environmental impact, and a building’s carbon footprint is only one of the possible environmental impact indicators.
Assessing environmental impact must also account for the resource use of construction materials
From the perspective of both manufacturers and designers, using the Estonian building materials database also raises problems stemming from the fact that the environmental impact of the construction materials in the database is expressed using the average GWP value derived from environmental product declarations (EPDs). EPDs are not widely used among Estonian construction material manufacturers; consequently, the Finnish market average emission factors are used. When it comes to GWP values, however, the decisive factor is the availability of renewable energy or nuclear energy in the country where the manufacturer is located — which means that emission factors from Finnish manufacturers’ EPDs, where significantly more favourable availability of renewable and nuclear energy places them at a distinct advantage, should not be used for setting Estonia’s construction sector climate impact reduction targets. From the perspective of the competitiveness of Estonian construction product manufacturers, it is important that comparable emission factors are used. When considering CO₂ emissions per capita, the only country with an energy balance comparable to Estonia’s is Germany, whose average emissions are 8.01 tonnes per capita, compared to Estonia’s 8.03 (Sweden: 3.61; Finland: 6.70).
It should also be noted that an EPD is in essence a sales argument demonstrating competitive advantage, which means EPDs are produced according to the needs of the product’s target market. For example, hollow-core slabs, TT-panels, and solid concrete panels are all used as ceiling panels. The Estonian materials database recommends using the EPD calculations of one specific manufacturer as the emission factor for all typical Estonian ceiling panels — without accounting for the fact that that company’s EPDs also include data from other product groups, not only hollow-core slabs. Consequently, neither the emission factor for the ceiling panel produced in that company, nor that for a typical Estonian ceiling panel, can be derived from this data.
A similar problem arises with window and door assemblies, for which the database lists a timber window, a timber-aluminium triple-glazed window, and a fire-resistant window as the options. The general GWP values assigned to these are taken from a single specific product — one belonging to a company that has invested significantly in reducing the climate impact of its products, thereby strengthening its competitive position relative to other Estonian manufacturers. This should certainly be reflected in the tool that architects and designers use to select materials with the lowest climate impact. If the actual climate impact of other window and door assembly suppliers is not genuinely comparable to the products shown in the database, then the use of the average GWP value for a “typical Estonian product” cannot be used to place those products on an equal footing in the eyes of architects and designers.
Accordingly, the construction sector must, under the Energy Performance of Buildings Directive, demonstrate a building’s climate impact expressed using the GWP greenhouse gas emission indicator (GWPtotal). Under the Construction Products Regulation, manufacturers of construction products must demonstrate the environmental impact of their product — that is, the impact across all lifecycle assessment-related essential characteristics and all circular economy environmental aspects.
What is a building’s environmental footprint?
The method for calculating a building’s environmental footprint, set out in standard EVS-EN 15978, involves assessing all impacts associated with a building that arise over its entire lifecycle:
- Production stage (A1–A3): extraction, processing, and transport of building materials
- Construction (A4–A5): impact of on-site construction activities
- Use stage (B1–B7): energy consumption, maintenance, renovation, water use, etc.
- Demolition and waste (C1–C4): building demolition and material disposal
- Recovery potential (D): material recycling or energy recovery.
Thus, impacts arising from resource circulation are just as significant as carbon emissions, and the calculation method supports a holistic picture. Since Estonia’s national guidance for the construction and real estate sector is designed to fulfil the requirements of the Energy Performance of Buildings Directive, what becomes mandatory is only the assessment of the climate impact of construction materials in the production stage (A1–A3) — i.e. only reporting the value of Level(s) indicator 1.2. The recommended national methodology for assessing environmental impacts does nonetheless allow the use of all Level(s) indicators, enabling the assessment of a building’s full lifecycle environmental impact.
Accurate results cannot be obtained using the emission factors given in Estonia’s building materials database
Within the framework of a master’s thesis in industrial ecology, we calculated the carbon footprint of a building at a housing fair using the methodology intended to become a national guidance document, but did so on the basis of two scenarios. In one scenario we used the EHEA emission factors. In the other scenario we used average emission factors for construction products from Germany, a country with comparable renewable energy availability — namely the ÖKOBAUDAT database. The results were verified using the SARV tool. The assessment report is presented in Appendix 3 of the master’s thesis and the calculations in Appendix 4.
For verification purposes we calculated the carbon footprint of a housing fair building using the methodology intended to become the national guidance document, doing so on the basis of two scenarios. In one scenario we used the EHEA emission factors. In the other scenario we used average emission factors for construction products from Germany, a country with comparable renewable energy availability — namely the ÖKOBAUDAT database [12]. The results were verified using the SARV tool. The assessment report is presented in Appendix 3 of the master’s thesis and the calculations and source data in Appendix 4 (link to master’s thesis below).
The building of the housing fair at Kivikirve tee 3, Manniva village, Jõelähtme municipality, Harju County — the builder had made a values-based decision to construct an environmentally friendly building and, accordingly, chose to use timber and timber-based materials, even in cases where the preliminary design would have permitted the use of, for example, metal or plastic materials. The calculations confirmed that as a result of values-based choices, a building had been constructed in which the materials used bind carbon. It was also confirmed that the calculated value of the carbon footprint depends on the emission factors used. Consequently, the availability of renewable or nuclear energy at the location where building materials are produced affects the calculated magnitude of the carbon footprint.
The most significant differences in the calculated carbon footprint arise from the share of timber and timber-based materials used in the building. First, the Estonian methodology requires a single GWP value to be used for each layer thickness of timber. The German database, however, requires the GWP value to be recalculated according to the thickness of the timber layer used. Consequently, when sawn timber is used in layers of differing thickness in different locations, the weight in those locations differs accordingly and so do the GWP values. Second, the EHEA associated with the Estonian methodology provides emission factors only for a specific list of building materials, and if materials are actually used that are not on the list, the nearest analogue must be selected. For example, the building at Kivikirve tee 3 used only timber frames, but EHEA does not provide for this, as the database contains only data for galvanised steel lightweight sections, which have substantially higher GWP values.
The analysis of building lifecycle stages A1–A3 demonstrated that the environmental impacts arising from building materials can indeed be quantified using the GWP indicator for building materials. The value of the indicator depends, however, on the emission factors used, and it should be noted that the EHEA database will inevitably assign a carbon footprint to every building. This is neither accurate nor fair in the case of timber and timber-based materials, since it is in fact possible to construct buildings using these materials that do not emit but sequester carbon.
With the aim of assessing whether the building as a whole also sequesters carbon, we also calculated the carbon footprint of the building’s other lifecycle stages and demonstrated that the building as a whole also sequesters carbon. It emerged that in the most significant lifecycle stage of the building’s total carbon footprint — the post-end-of-life waste treatment stage (C3) — the default values used materially distort the results of the assessment. In Estonia’s recommended methodology, the calculated weight of materials is increased in stage A5 using default waste rate percentages, and in stage C3 using default emission factors based on the waste management classification of the material. The waste rates and waste management classifications are based on existing practices, and the Estonian calculation model has only three:
- metal — C3 class 1.00, default value 0.002 kgCO2/kg;
- timber — C3 class 0.75, default value 0.02 kgCO2/kg;
- mineral — C3 class 0.75, default value 0.006 kgCO2/kg.
In a functioning circular economy, the actual basis should be user guidance that can be adapted to the specific project and technology. With the entry into force of the Construction Products Regulation in January 2025, it is known that this guidance will take the form of the product requirement information contained in the digital product passport.
Summary
The Estonian construction carbon footprint calculation methodology makes it possible to calculate both the carbon footprint and the environmental footprint of a building. To obtain accurate results, however, it is necessary to use not the averaged data from EHEA but the data from specific EPDs — and, in the future, data from digital product passports.
References are available here: Anu Kull TalTech thesis: quantification of circularity
When citing this text, please include the reference: A. Kull, Circular Village: a circular economy business model in real estate development. Tallinn University of Technology, 2025.
[i] A. Oviir, K.-A. Kertsmik, V. Voronova, and S. Vares, “Building lifecycle carbon footprint calculation methodology. A technical document describing Estonia’s national carbon footprint calculation methodology. LIFE IP Build EST, Tallinn 2024.
[ii] Accessed at https://kliimaministeerium/elukeskkond-ringmajandus/energiatohusus-ja-keskkonnasaast/hoone-susinikujalajalg. Consulted 12.08.2025.